A deep understanding of crypto charts is the key to success for novice traders. After all, for profitable trading, it is not enough just to know the price and the name of the asset. In this article, we will analyze the basic concepts, measures, and indicators that you will encounter on your way.
What is the Dow Theory?
Dow Theory is a framework for technical analysis based on the writings of Charles Henry Dow on market theories. Charles Henry Dow is an ancestor of technical analysis and one of the founders of the most popular Dow Jones Index (DJI).
6 Tenets of Dow Theory

- Market prices take everything into account
The market price is never random. It takes into account: the reaction of market participants to the news, their expectations, their optimism (“bull market”) or disappointment (“bear market”), and so on.
- There are three trends in the market
Three trends coexist in any market: short, medium, and long.
- The long-term has three phases
The accumulation phase is when the price as a whole does not change and fluctuates within a small range. The most savvy investors in this phase, after analyzing the market, accumulate an asset.
Phase of public participation. When a crowd starts buying an asset.
The speculation phase. It ends with a downward trend (correction) and accumulation begins again.
In a bear market, the phases are triggered in the opposite direction.
- Indexes should confirm each other
The signals that appear in one index must match with the signals of another index.
- The volume should confirm the trend
The purchase/sale volumes of the asset should increase/decrease in the same direction as the trend.
- The trend is considered valid until a clear signal of a reversal is received
This is not so easy to predict, since no one knows exactly when the price will break the trend and go in the opposite direction. It is quite difficult to distinguish a secondary trend from a primary one in practice.

What’s a technical analysis?
Technical analysis is a set of tools for predicting likely price changes. It is based on patterns of price changes in similar circumstances in the past. The basis of technical analysis is the analysis of price charts and exchange glass. In technical analysis, so-called patterns are often considered and analyzed. These are typical combinations formed on price charts (“Double Bottom”, “Triangle”, “Flag”, etc.).
What is a cryptocurrency market cap?
Market capitalization is the real-time value of the cryptocurrency network. This indicator is one of the most important. The larger the market cap, the lower the volatility of the asset. Also, large capitalization is a kind of public recognition indicator.
The market capitalization is calculated easily. It is necessary to multiply the number of circulating coins by their value.

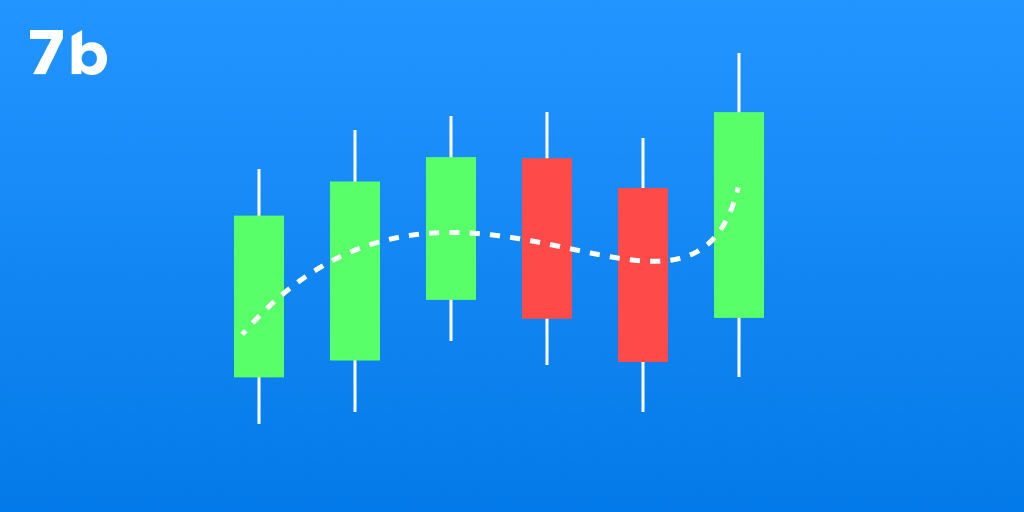
The Japanese candlestick charts
The “Japanese Candlesticks” chart displays not just a chaotic movement of quotations, it also very sensitively captures the mood of the crowd. And since the moods are cyclically repeated, the same pictures periodically appear on the chart.
With the help of a candle, a trader can analyze 4 main factors: the opening and closing prices, maximum and minimum prices.
To determine these points, it is necessary to determine the body and wicks/shadows of the candle.

The body of the candle is usually colored red (bearish) or green (bullish).
If the candle is green, then the opening price is indicated on the bottom face of the candle, and the closing price lies on the upper face. And vice versa in the case of a red candle.
Wicks are thin lines that are drawn from the body of the candle and display the maximum and minimum prices for the time frame.
Support and resistance
The support level differs from the resistance level in that it is located under the price, as if supporting it and not letting it fall below its value. And the resistance level, respectively, is located above the price and does not allow it to grow above its value.
In general, there is a constant battle between bears (sellers) and bulls (buyers) in the market, thanks to which levels are created. The principle is as follows: when the price falls, bulls enter the battle, buy an asset, its price rises and reaches the resistance level. When resistance is reached, bears actively sell the asset, which is why its price falls and reaches the support level.
Understanding of Relative Strength Index
RSI stands for Relative Strength Index. By its nature, the RSI indicator is an oscillator, i.e. it fluctuates in a certain zone limited by the maximum (100) and minimum value (0). Depending on the location of the line relative to this scale, the trend, its strength and reversal moments are determined.
The closer the RSI line is to 0, the more the downward trend weakens.
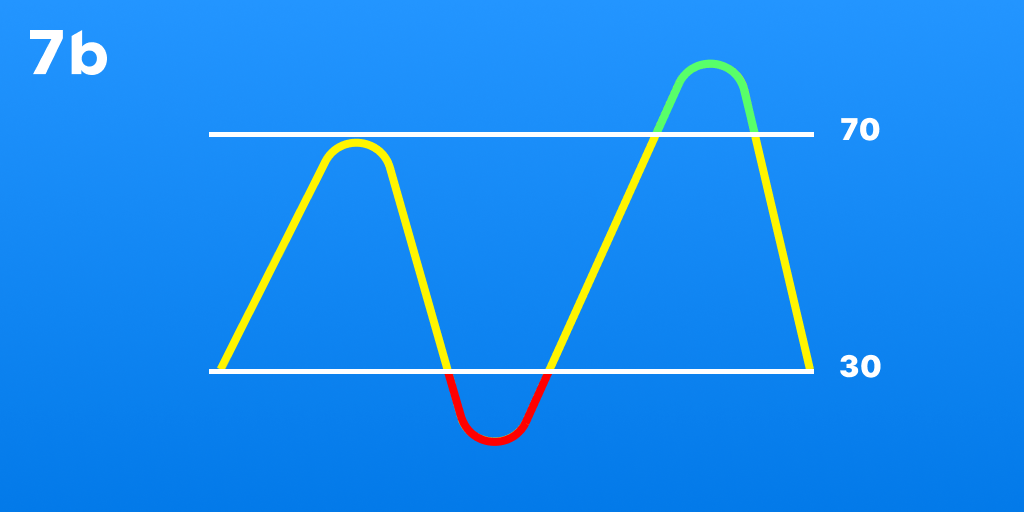
The closer to 100, the less the growth force of the price.
There are two main scales 30 and 70. When the line goes beyond these limits, it is more likely that the current trend is coming to an end, after which it will be followed by a reversal.
Cryptocurrency analysis tools
The following list of tools will be extremely useful for both novice traders and experienced ones:
The service provides a set of tools for technical analysis. There are all the necessary indicators for traders.
On the service, you can get acquainted with the most significant data about a particular cryptocurrency: historical price dynamics, market capitalization, price, circulating supply, a list of new cryptocurrencies on exchanges, and much more.
This is a cryptocurrency calendar that displays important events and the dates of their occurrence. On the platform, you can track network updates, launches, hard forks and other important events.
This is the platform where you can monitor the development of a particular cryptocurrency, the analysis of the development team, the contribution of each of the participants, etc.
Final words
Price analysis is only part of the task, because it is equally important to understand the causes of sharp ups and downs. So do not forget to follow the news that may affect the state of the cryptocurrency market — if something significant happens, no charts will help predict the subsequent price jump.